
EXEC SUMMARY
Moving a critical maintenance workflow off a legacy system.
Dugo is a B2B platform used by telecom companies to document and visualize maintenance activity across critical network infrastructure. Our client, one of the largest telecom providers in North America,was in the process of adopting Dugo, but still relied on a legacy system to document issues found by technicians in the field.
I led discovery, product definition, UX/UI design, client workshops, testing, and implementation support, working with users and stakeholders, Dugo's product team, and developers.
My Role
Product Designer + Manager
Timeline
Jan - May 2025
Toolbox
Figma, Jira, Miro
PROBLEM
How might we make field issue reporting easier to capture and easier to act on?
Technicians were logging issues through a fragmented, unstructured process, leaving managers without a clear view of recurring problems, priorities, or trends.
THE PROJECT
Replacing a fragmented issue reporting process with a structured workflow in Dugo
Context
Telecom field technicians regularly visit sites to inspect equipment, complete maintenance, and document any issues that need follow-up. Managers rely on these reports to understand what is happening across the network and decide where action is needed.
The client was transitioning to Dugo but still relied on a legacy system for issue reporting. They initially asked us to bring that data into Dugo to create a clearer, centralized view across sites.
Business Objectives
Reduce the time technicians spent documenting issues on site
Reduce repeat or unnecessary truck rolls caused by incomplete documentation or outdated reporting
Give managers faster access to current, actionable issue data without reading through lengthy free-text reports
Research Approach
We worked closely with technicians and managers throughout the project to understand the existing workflow, test new concepts, and continuously refine the experience before and after launch.
10+ interviews with technicians and managers to understand pain points, workflows, and needs
User journey mapping to identify breakdowns in the existing reporting process
Usability testing with prototyped experiences to validate and refine new workflows
Training sessions used to both onboard users and gather feedback on the live experience
Post-launch feedback sessions to identify opportunities for continued improvement
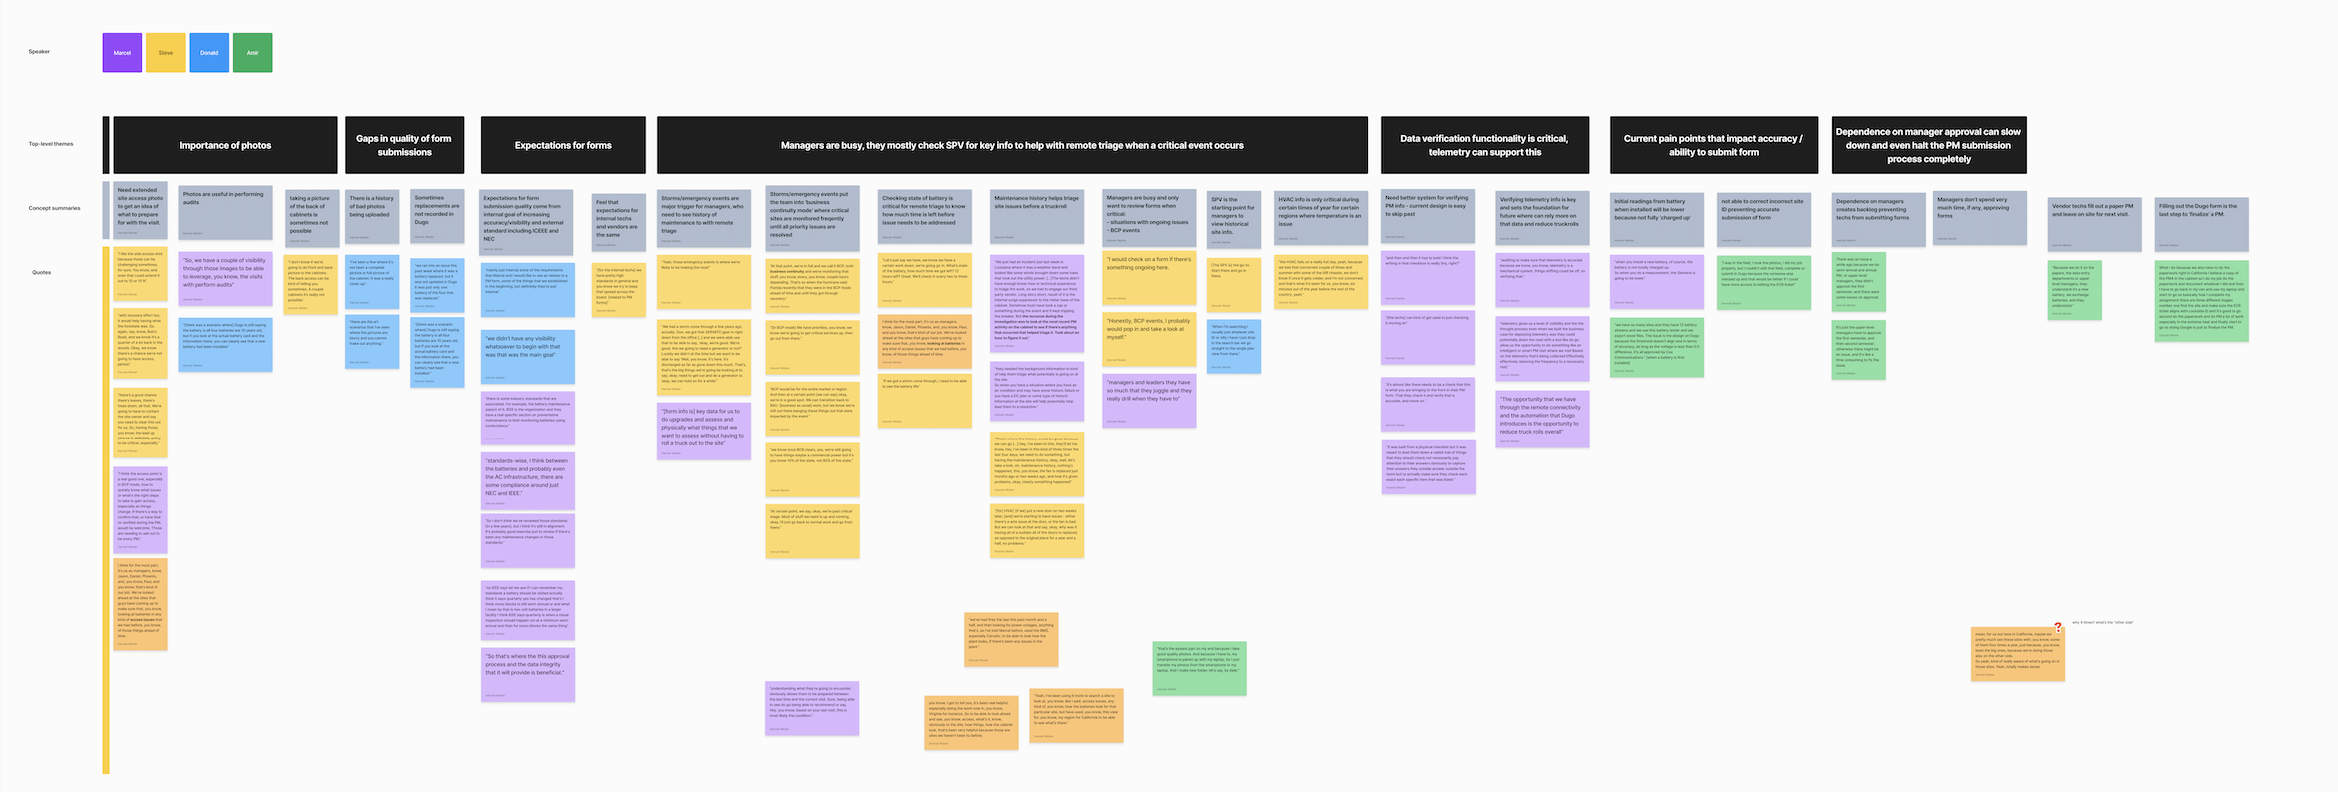
Affinity mapping key insights from conversations with field technicians and managers to help understand main pain points.
Key Learnings
1) The data was too unstructured to build a meaningful source of truth
Early research revealed that nearly all issue data in the legacy system was captured through free text. The same problem could be described in multiple ways, with inconsistent wording, typos, and varying levels of detail, making it impossible to reliably aggregate issues or understand patterns across sites.
Even if we built a new dashboard, the underlying data would not support the high-level visibility managers needed. This shifted the project from visualizing legacy data to redesigning how issues were captured at the source.
2) A systems thinking approach revealed the broader ecosystem involved in issue reporting.
Conversations with technicians and managers uncovered additional stakeholders, handoffs, and edge cases that the existing system did not support. As a result, teams relied on inconsistent workarounds that created friction and poor-quality data.
Mapping the full ecosystem helped us design a more balanced reporting process that could work across roles, scenarios, and responsibilities.
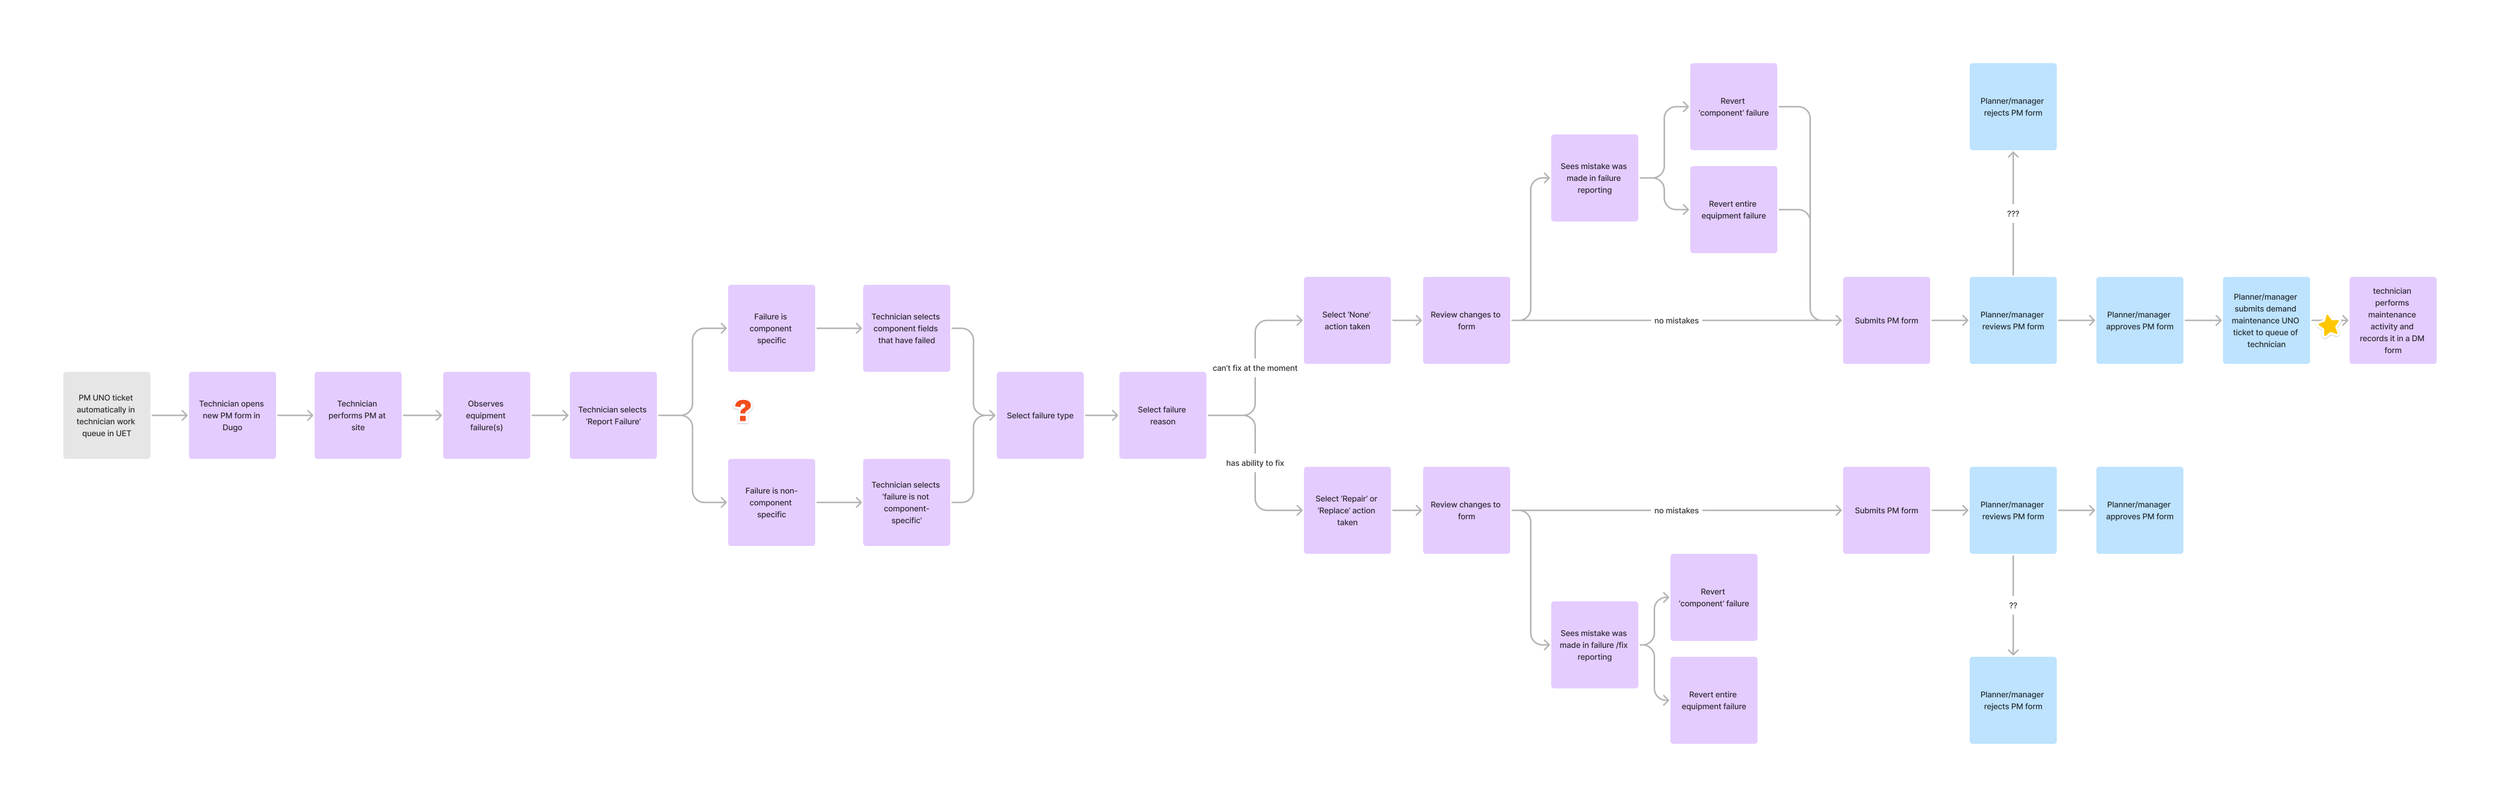
3) We discovered issue reporting had two very different use cases: preventative maintenance and emergency response
Dugo’s core value proposition had been built around preventative maintenance, giving managers a high-level view of site health and upcoming work. Research revealed a second, critical use case: when a telecom site goes down, teams follow an emergency response process involving additional stakeholders, handoffs, and decisions.
Supporting this reactive workflow became essential if the client was going to fully move off the legacy system and rely on Dugo for issue reporting.
FINAL SOLUTION
We rebuilt issue reporting end to end, then turned that data into a meaningful operational view
Rather than only layering a dashboard on top of legacy data, we redesigned how issues were captured in Dugo and how that information was surfaced back to managers.
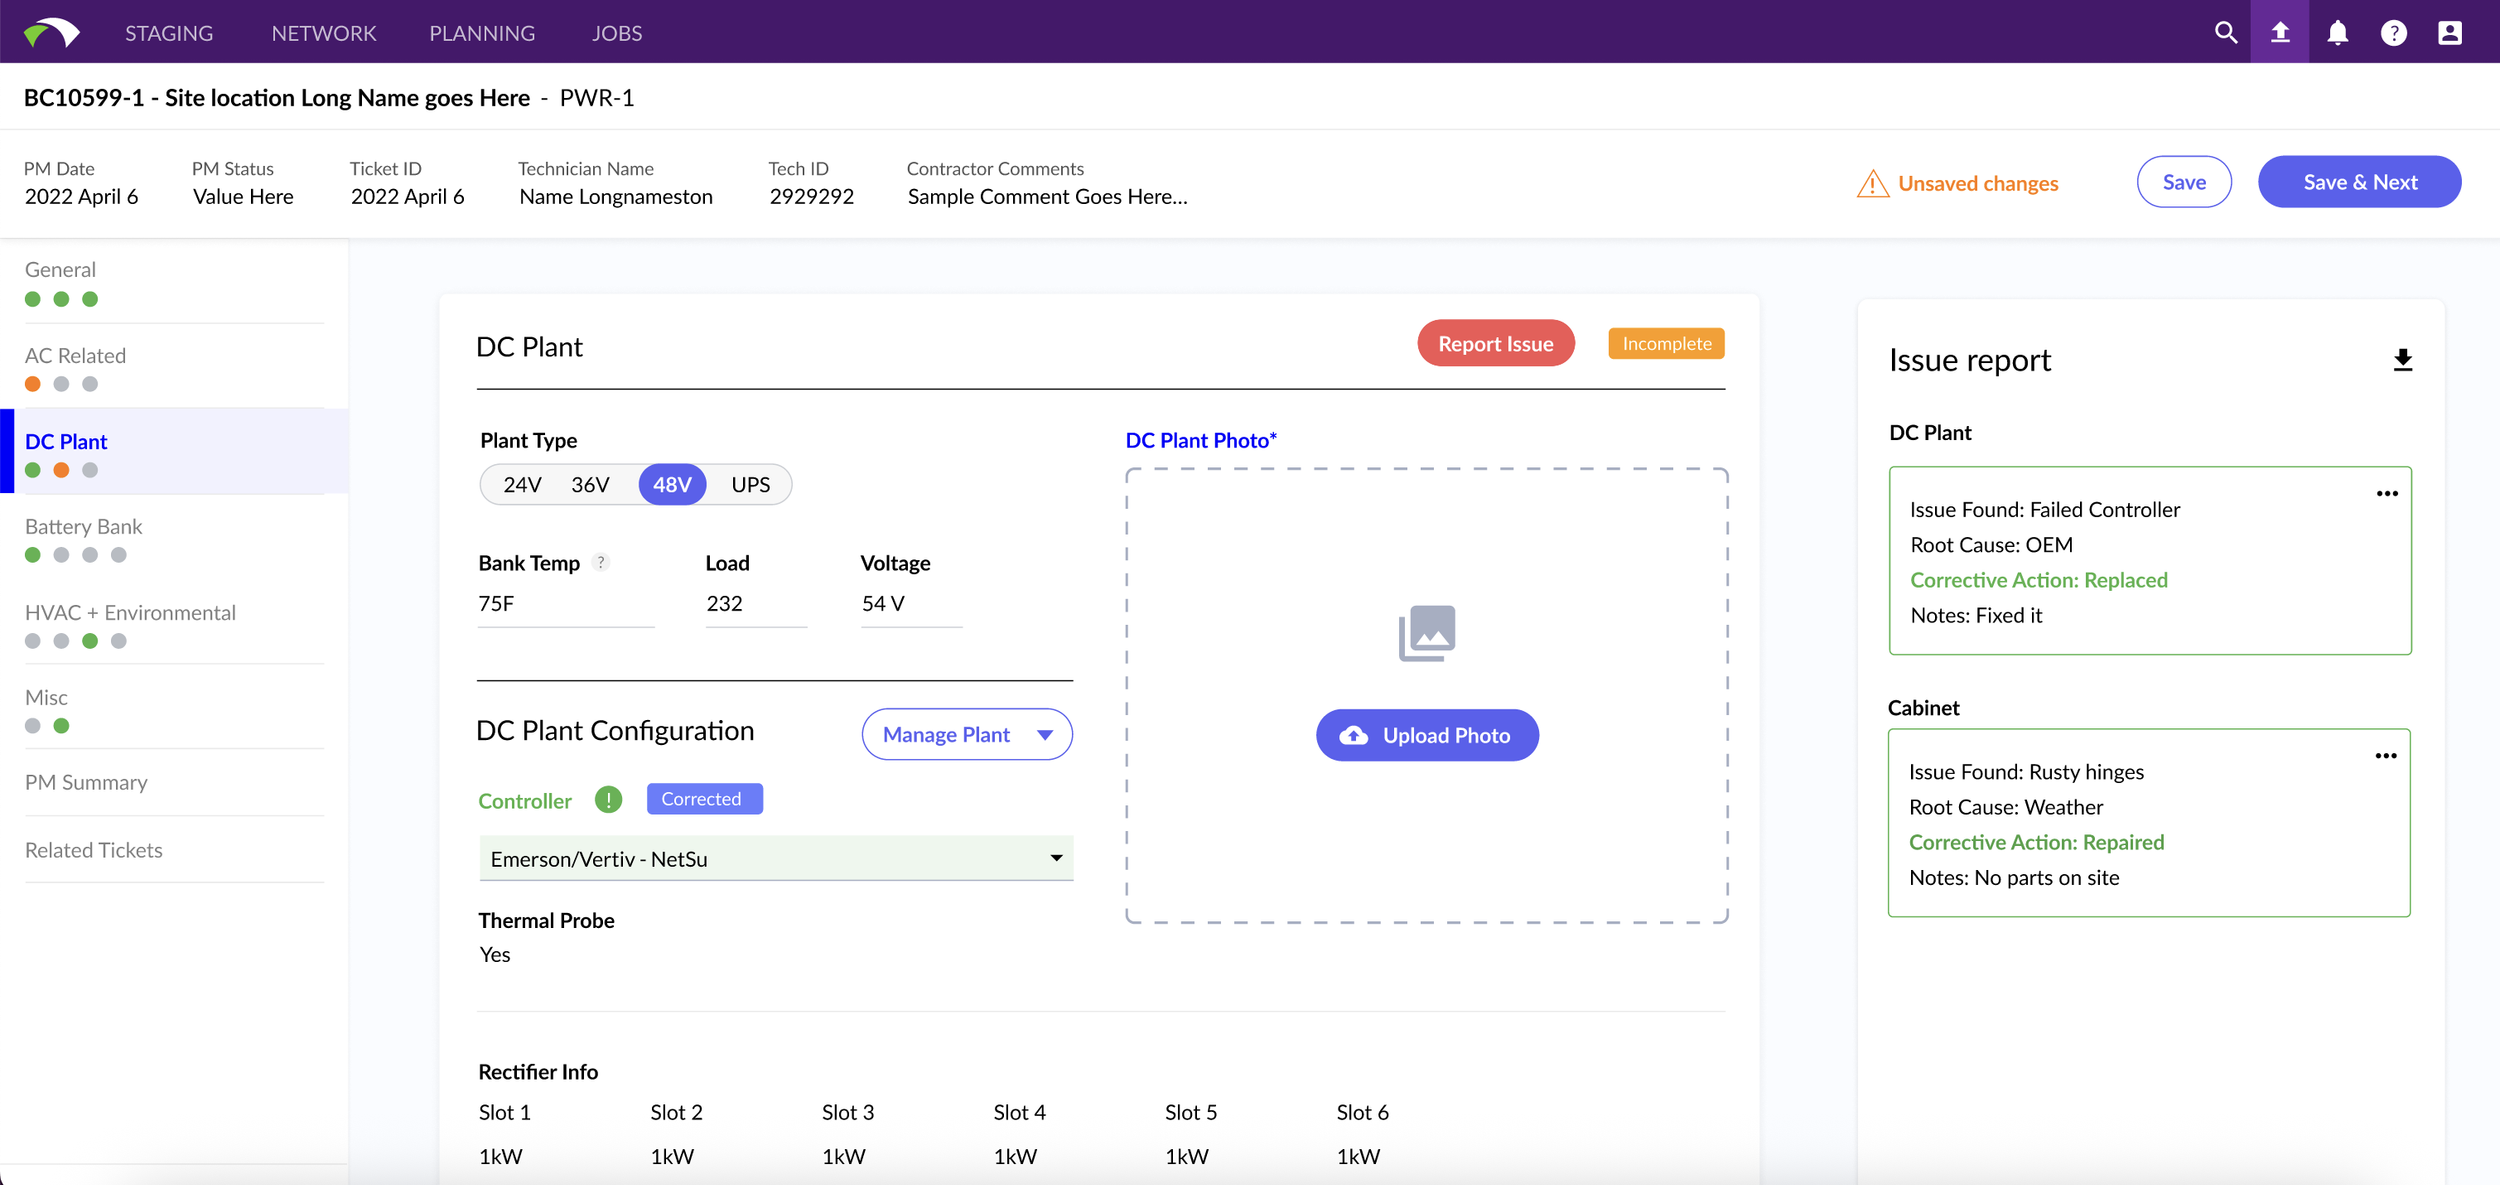
New issue reporting flow
We created a structured reporting process that accounted for the stakeholders, edge cases, preventative maintenance, and emergency response workflows uncovered through research. This made reporting more consistent while capturing data that could actually be analyzed.
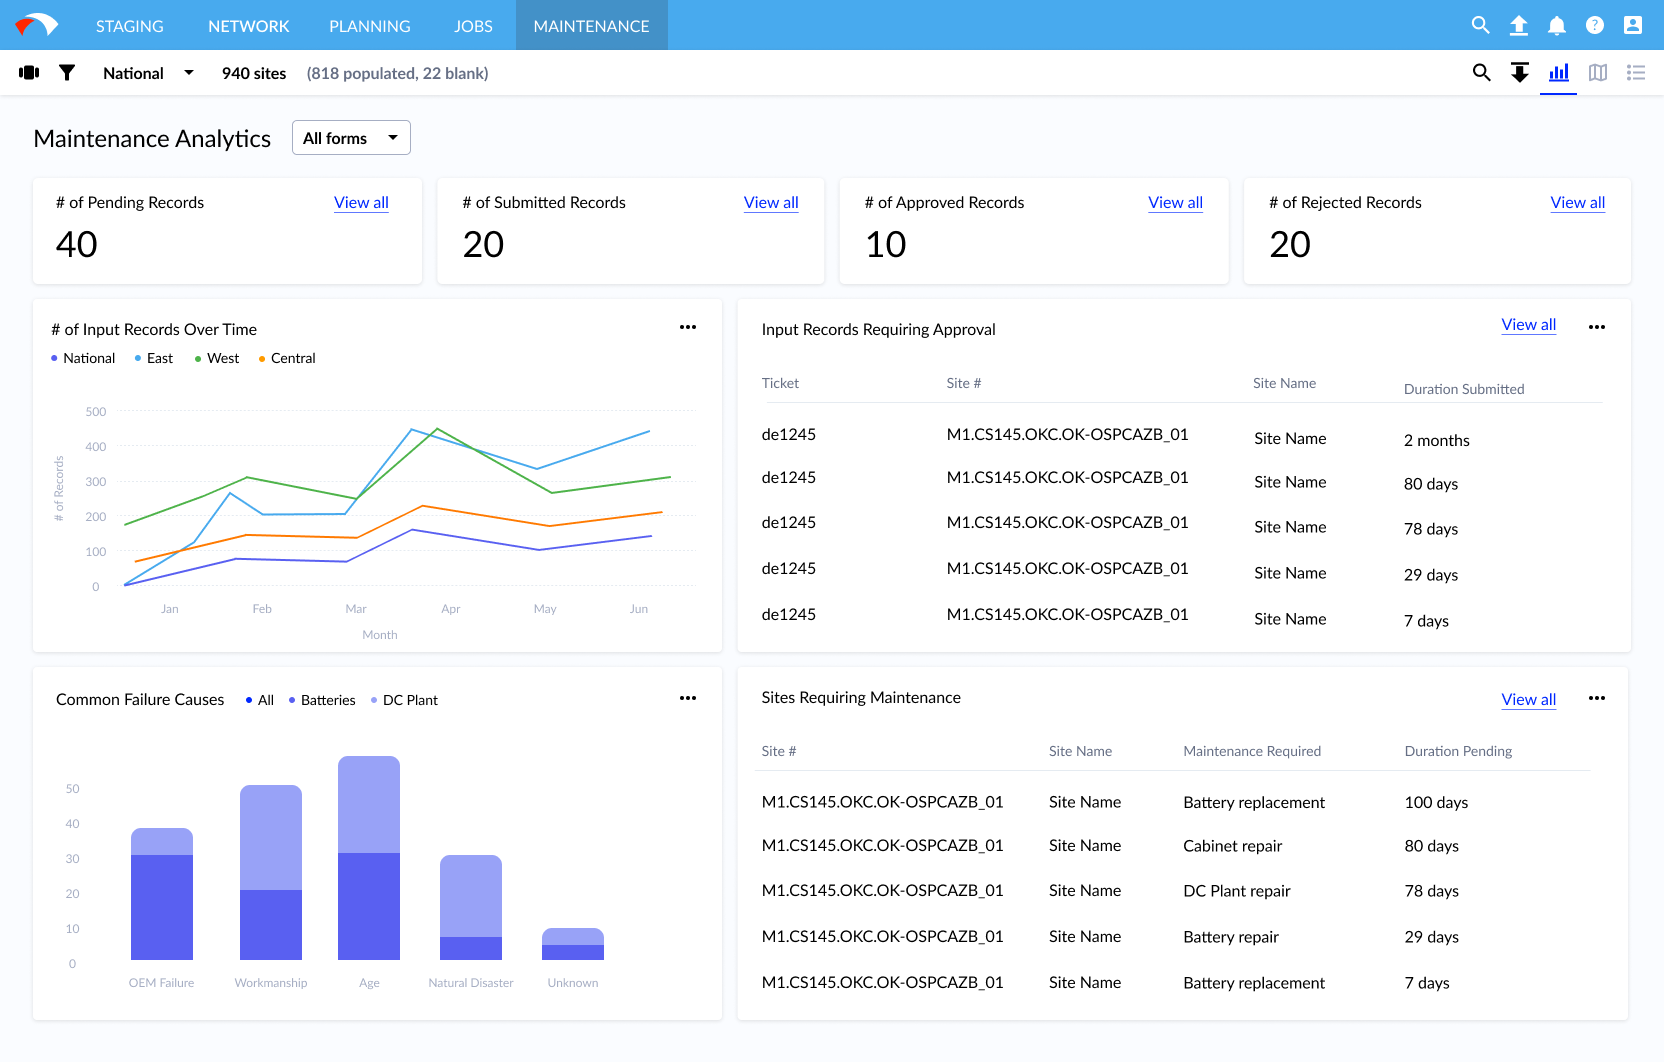
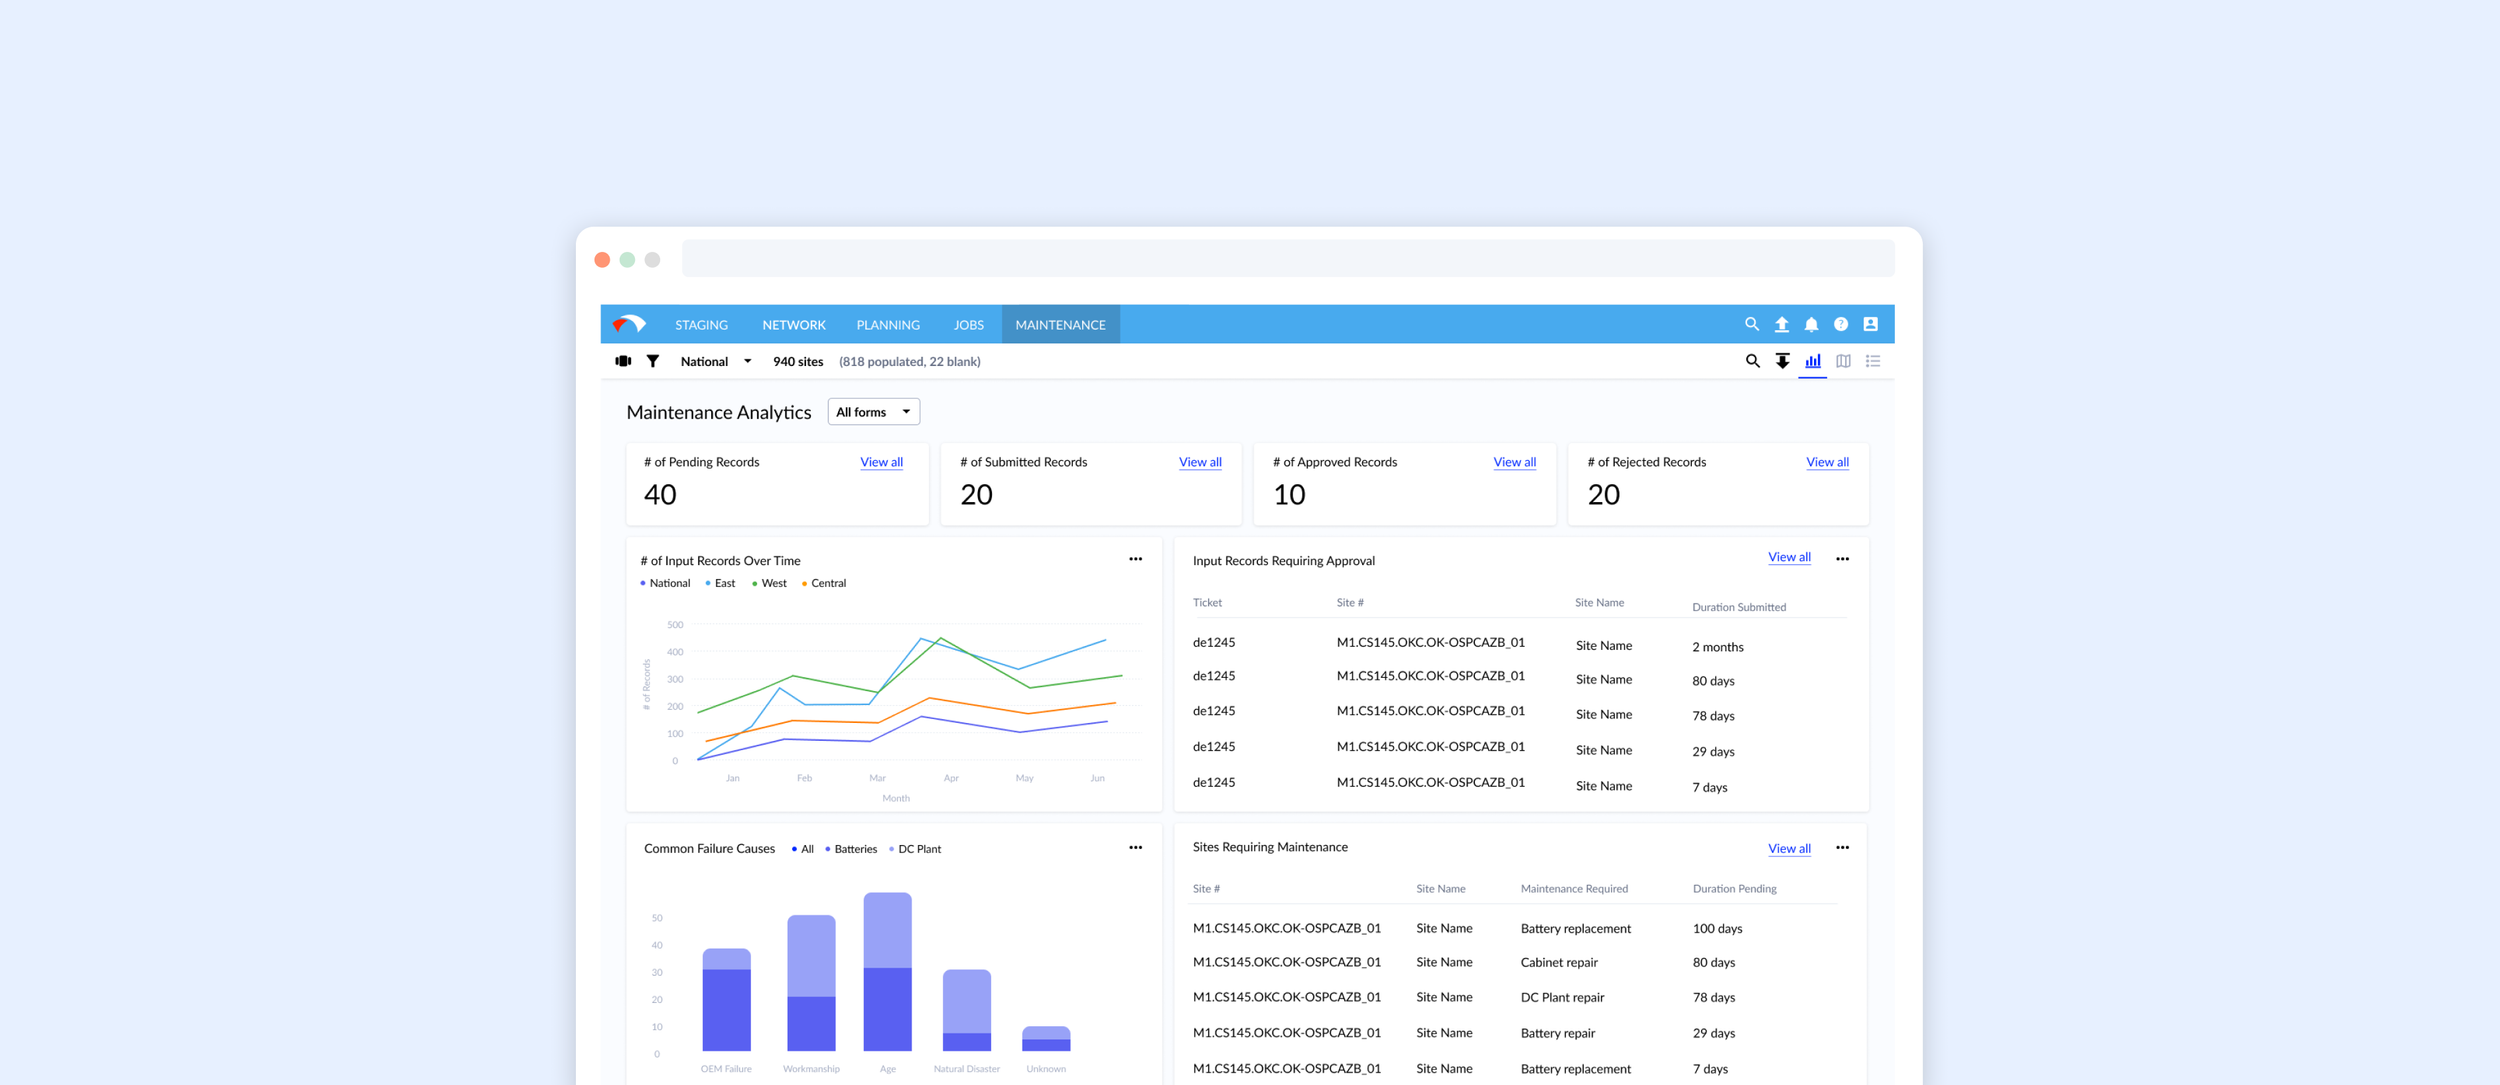
Site health and maintenance dashboard
We then used that structured data to give managers the visibility they originally wanted: a clear view of issues requiring immediate attention, overall site health, upcoming maintenance needs, and whether teams were on track with required truck rolls and site visits.
Reflection
This project reinforced something that has shaped how I approach product work since: a feature request is often a description of the symptom, not the underlying problem. The client’s dashboard request made complete sense. Managers lacked visibility, so better reporting seemed like the obvious answer. But tracing the problem back through the system showed that the higher-leverage opportunity was upstream, in how the data was being created. The most important design decision was not what the dashboard looked like. It was deciding that we should not build it on top of a workflow that was already failing.